Analyze Your Spreadsheet Data in Half the Time with Topo.ly Online Mapping
March 26, 2013 (PRLEAP.COM) Business News
Data analytics tools are integral to most businesses and organizations. They help make the jobs easy. As one of the best GIS solutions today, Topo.ly proudly features easy to use mapping technology coupled with interactive tools to help users create free maps from Excel spreadsheet locations on the fly.Map creation has been known for many years as one of the most innovative data analysis tools to help business experts understand data, serve customers better, and grow business. Decision making can be simplified by using mapping technology.
Excellent Features of Topo.ly Online Mapping
Build Maps from Excel Data
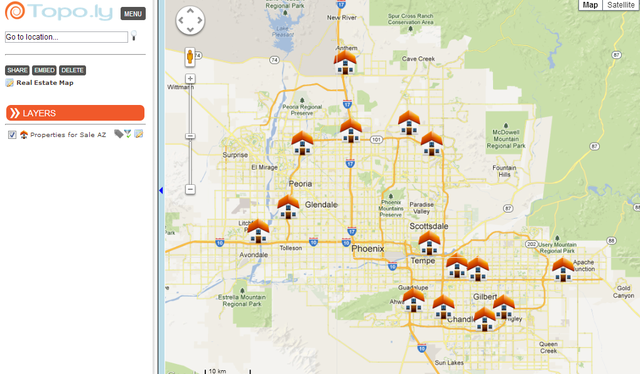
From your existing customer data stored in Microsoft Excel, building a map will only take three minutes at most. Users simply copy their data and paste it into Topo.ly. As they view their maps within minutes, they can visualize their data for advanced analysis. Customers only have to paste all their location data all at once and they can build maps that easy.
Geocode Lists of Addresses
Geocoding is important to know the exact latitude and longitude of each location entry. As soon as they are identified, plotting the location comes next. Topo.ly no longer requires its users to produce their own coordinates. Users only have to paste their locations and Topo.ly will do the rest.
Filter Visible Locations
For data analysis, users need to see certain locations only. Topo.ly makes it possible for the users to filter their locations. They are able to see only the specific location categories they need for in-depth analysis. This feature empowers the users to experience a whole new level of visual analysis. By filtering the locations, they tend to determine which of their locations have the greatest improvements and which need the most attention.
Add Multiple Data Sets
One of the many advantages of using Topo.ly maps is its ability to add unlimited data sets to maps easily. This feature is essential, especially when one needs to see the relevance between two or more data sets. For instance, you suppose a business wants to do some analysis on the correlation between suppliers, retail outlets, customers and distribution centers. Looking at a bunch of maps at same time can get confusing. But by plotting each layer onto a single map, analysis will be better and easier.
Experience data analysis with Topo.ly online mapping today!
