Climate Change has caused Ontario and Alberta home insurance rates to increase by 64 per cent and 140 per cent, respectively: RATESDOTCA
June 04, 2021 (PRLEAP.COM) Business News
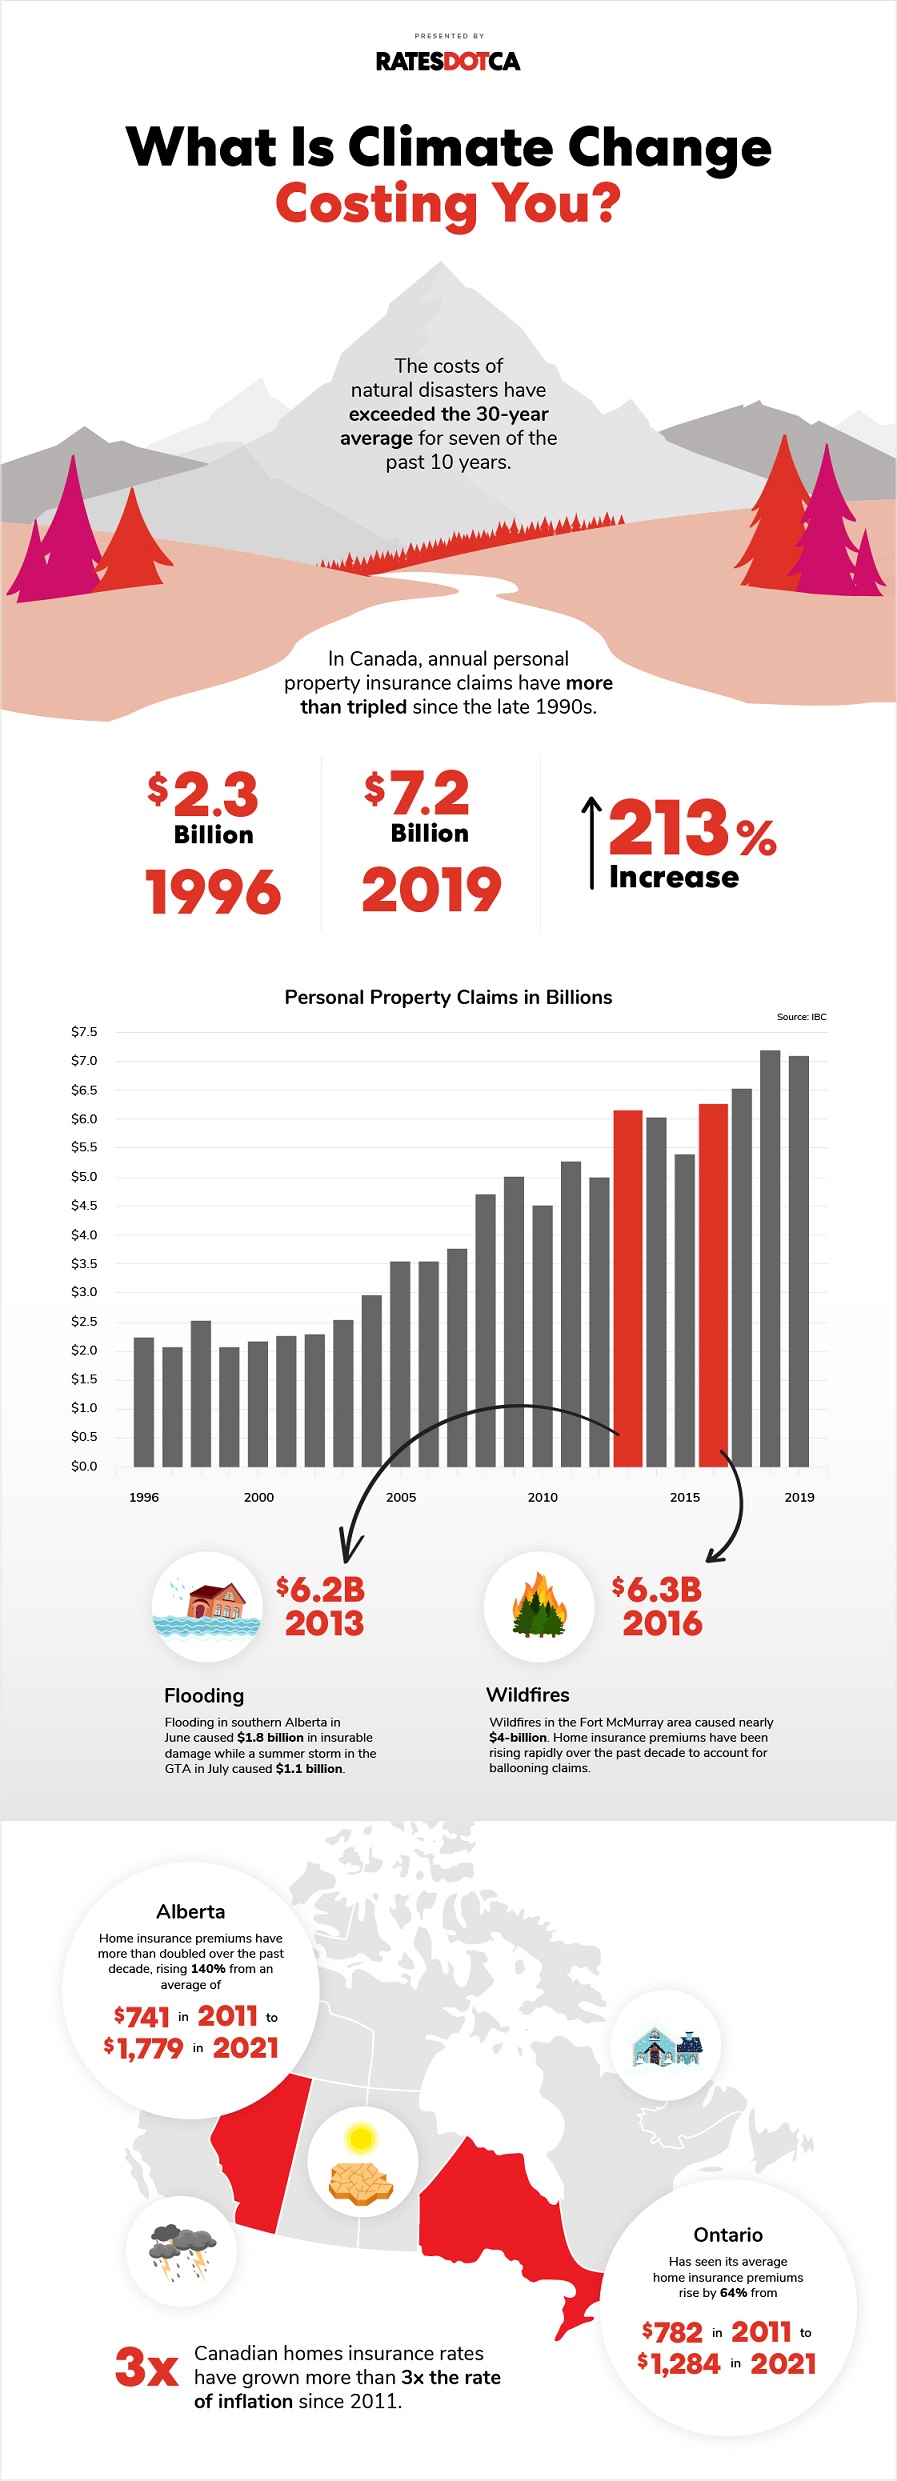
TORONTO, June 4, 2021 As climate change-related natural disasters accelerate in terms of both frequency and cost, Canadian homeowners are increasingly feeling the financial impact in their insurance premiums. According to new analysis from RATESDOTCA, the average cost of home insurance has grown at more than three times the rate of inflation over the past decade as personal property damage claims have grown 42 per cent nationwide over the same timeline*.Alberta has seen the most dramatic growth, with average home insurance rates in the province rising 140 per cent since 2011 from $741 to $1,779 as of early 2021. In Ontario, premiums have grown by 64 per cent over the same period, from $782 in 2011 to $1,284 this year. According to the Bank of Canada, inflation over the past decade has totaled less than 17 per cent.
Growth in total property claims made through home insurance policies explains this trend. According to the Insurance Bureau of Canada, personal property claims nationwide have more than tripled since 1996, rising 213 per cent from $2.3-billion to nearly $7.2-billion. That is in line with global trends, as Australia's QBE Insurance Group said in its 2020 annual report, the economic cost of natural disasters has exceeded the 30-year average for seven of the past 10 years.
"Climate change is already having direct financial impact on individual Canadian homeowners," said Jameson Berkow, managing editor of RATESDOTCA. "Everyone should be motivated to take action on climate change, but this data should add even more incentive by putting a clear dollar value on the costs of inaction."
Homeowners can better protect themselves from the rising costs of climate change by checking their policy to ensure they are covered for any associated event that might occur.
Overland flooding insurance has been available in Canada since 2013 and according to the Institute for Catastrophic Loss Reduction, every homeowner should consider adding it to their policy even if they don't live in a floodplain.
Other tips to keep homes safe from extreme weather:
Installing a back water valve/sump pump in basements (telling an insurance provider about this could result in a discount)
Regularly cleaning gutters/pipes
Adjusting downspouts away from homes and onto the street
Clearing five feet of vegetation around a house, which can halve the risk of a home being destroyed by a wildfire
Using impact-resistant materials on roofs, especially in a hail zone
Avoiding planting coniferous trees, which are more flammable than deciduous trees
Getting water flooding coverage included in insurance policies (check with insurance provider since most require this to be purchased separately)
*Home insurance prices are based on RATESDOTCA data for policy transfers from 2011 through early 2021. The full dataset is included below for your reference. Personal property damage claims growth rate is based on Insurance Bureau of Canada (IBC) data from 2009 through 2019, the most recent ten-year period available.
About RATESDOTCA
RATESDOTCA is Canada's leading rate comparison website that offers a quick and simple digital experience to compare the widest selection of insurance and money products in the market. Get a better rate on car, home, and travel insurance, mortgage, and credit cards all in one location. RATESDOTCA aims to help Canadians make better insurance and money decisions so they can save time and money to spend on what really matters to them. @RATESDOTCA
RATESDOTCA
360 Adelaide Street West, Suite 100
Toronto, Ontario, Canada
M5V 1R7
+1 844-726-0907
Data below from RATESDOTCA.
TOTAL COST OF HOME INSURANCE (excluding condo/tenant policies)
ALBERTA:
YEAR AVG HOME INSURANCE PREMIUM (CAD$)
2011 741
2012 845
2013 830
2014 931
2015 991
2016 1192
2017 1212
2018 1288
2019 1265
2020 1355
2021 1779
ONTARIO:
YEAR AVG HOME INSURANCE PREMIUM (CAD$)
2011 782
2012 746
2013 763
2014 730
2015 791
2016 918
2017 918
2018 957
2019 1150
2020 1164
2021 1284